

Market Flash - Navigating Post-Election Volatility
Key Takeaways
- The selloff was sharp, but the stress was concentrated. AI-related stocks bore the brunt of the decline, while Treasury bonds provided diversification and broader financial markets showed less stress.
- A slower data-center buildout does not mean the AI investment cycle is over. After an extraordinary period of spending, greater constraints, competition and scrutiny may lead to more disciplined investment, stronger return requirements, and greater differentiation between winners and losers.
- The broader investment backdrop remains supportive. Corporate earnings remain healthy and have broadened beyond the largest technology companies, while history suggests that large one-day declines alone have not been a reliable reason to reduce long-term equity exposure.
Market Selloff – What Happened?
Stocks sold off sharply today, with the S&P 500 down 4.4% and the Nasdaq down 5.5%, as investors reassessed the AI trade following Democratic election victories and the potential for restrictions to slow the data-center buildout. The concern hit semiconductors hardest, with the chip index down roughly 12%, turning what began as a policy concern into a broader risk-off move that erased Wednesday’s post-election rally.
The equity market selloff appeared to be aggravated by hedge funds that were forced to reduce leverage. Hedge funds entered 2026 with record levels of leverage, much of it concentrated in a relatively small number of AI-related stocks. As those stocks fell, the funds were forced to sell more shares, exacerbating the declines.
Importantly, the stress did not spread evenly across financial markets. Treasury yields fell as stocks declined, and high-quality bonds continued to provide diversification. Shorter-term yields led the move lower, with the 2-year yield falling about 10 bps to 4.48% and the 10-year falling about 5 bps to 4.84%, both near two-month lows. The larger drop at the short end came as the odds of a December Fed hold rose to about 29% from 17% a day earlier, though subsequent hikes remain more likely. High-quality bonds have held up better than lower-quality credit on Thursday, with the ICE BofA US Corporate Index returning 0.13% compared with -0.22% for the ICE BofA US High Yield Index. Credit spreads widened, with technology-related bonds (particularly lower quality bonds) seeing a larger increase than the broader investment-grade corporate market.
Data Centers
Data Centers were a political issue prior to November 5 and will likely remain one. While political uncertainty affects the timing and economics of the buildout, projects already underway are less exposed and the broader demand for computing capacity is unlikely to disappear.
Data centers most at risk are those that have not yet broken ground:
- BMI, the research division of Fitch Solutions, views a national moratorium as unlikely and notes that 2027 construction schedules are largely locked in. Greater uncertainty begins with projects scheduled for 2028 and beyond.
- BMI estimates that 53% of hyperscaler pipeline growth is concentrated in newly flipped governor states such as Texas, Georgia, Ohio, and Pennsylvania.
Nearly 60% of Planned U.S. Data-Center Capacity Faces Policy Uncertainty
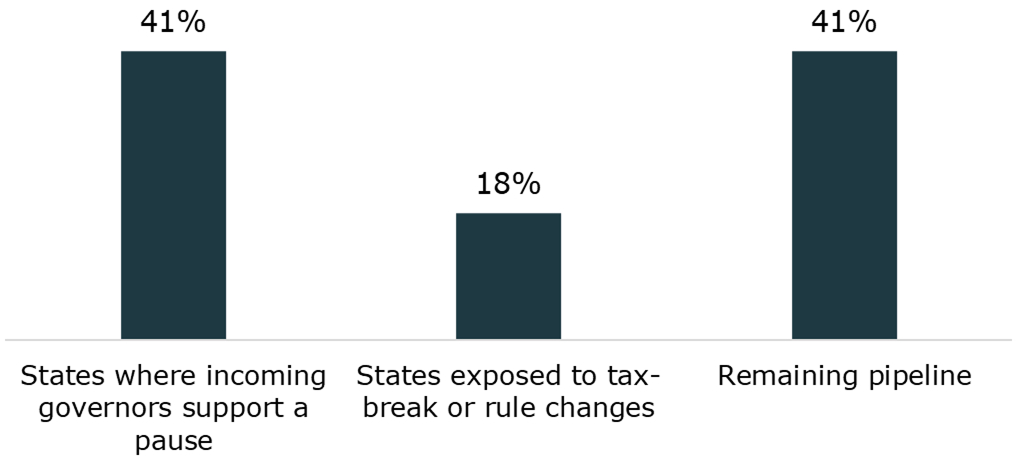
Source: Kestra Investment Management with data from Cleanview. Data as of November 4, 2026.
Policy changes could require developers to bear more of their power and grid costs, secure additional clean energy, or provide greater transparency to local communities. Projects with secured power, permits, committed tenants, and strong financing should be better positioned, while more speculative projects could be delayed or dropped.
A slower buildout would not necessarily be negative across the industry. Existing capacity could become more valuable, while greater scrutiny could force technology companies to be more disciplined about capital spending and expected returns.
While the policy outlook changed this week, the fundamental backdrop changed much less than stock prices. Demand for computing capacity remains strong, projects already underway are less exposed to future policy changes, and corporate earnings remain healthy and increasingly broad.
What’s Next for the Market?
A 4% decline in a single day is unusual, but it has not historically been a reliable signal of what comes next. While returns vary considerably following these episodes, stocks have generally recovered over the following months, illustrating the risk of reacting to a sharp one-day move by reducing long-term equity exposure.
S&P 500 Average Change After 4%+ One-Day Declines
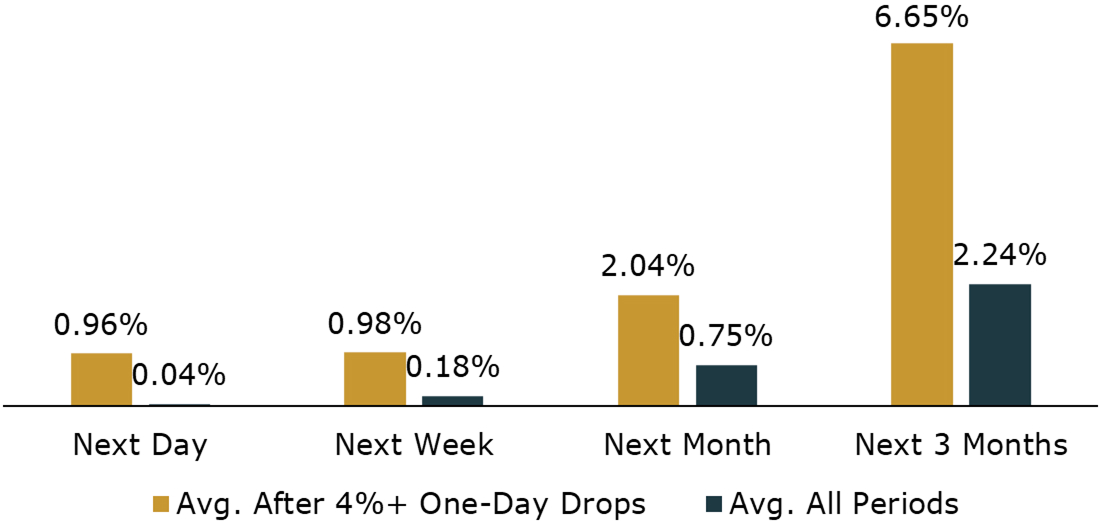
Past performance does not guarantee future results. Indexes are unmanaged and not subject to fees. It is not possible to invest directly in an index. Source: Kestra Investment Management with data from Bespoke Investment Group.
What It Means for Portfolios
Company fundamentals are strong, providing an important counterbalance to recent market volatility. Importantly, earnings growth is broad: while 2023-2025 earnings growth was concentrated in the largest tech companies in the world (The Magnificent 7), this year, the remaining 493 companies in the S&P 500 are outpacing the earnings growth of their mega cap counterparts.
S&P 500 3rd Quarter Earnings Growth: “Magnificent 7” vs “S&P 493”
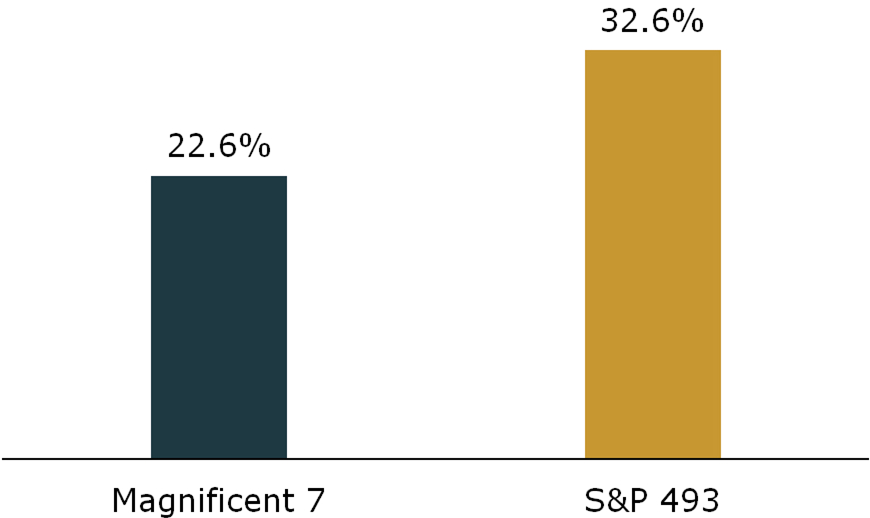
Past performance does not guarantee future results. Indexes are unmanaged and not subject to fees. It is not possible to invest directly in an index. Magnificent 7 represents Apple, Amazon, Google, Tesla, Microsoft, Nvidia, Meta. S&P 493 represents S&P 500 companies excluding the Magnificent 7. Source: Kestra Investment Management with data from FactSet. Data as of October 30, 2026.
It’s worth repeating that days like today show the value of diversification, as high-quality bonds rose while stocks fell, helping offset some of the equity losses in balanced portfolios.
Conclusion
AI-related spending is on pace to become one of the largest infrastructure buildouts in history. It is only natural that a cycle of this size would eventually encounter constraints, whether from power availability, permitting, financing costs, or greater scrutiny of the returns on each new dollar invested.
The AI cycle is also maturing. Competition is increasing, funding is more expensive, and investors are becoming more discerning about which companies can turn large investments into sustainable earnings and cash flow. That greater differentiation may create volatility, but it is also a sign of a market becoming more disciplined.
A slower pace of data-center development could have benefits as well. Scarcer existing capacity may become more valuable, constraints could encourage more efficient use of power and computing resources, and a more measured investment pace could allow companies to protect free cash flow and demand stronger expected returns before committing additional capital.
Today's selloff reflects a meaningful reassessment of the pace and economics of the AI buildout. It does not necessarily signal the end of that buildout or a deterioration in the broader investment outlook. For investors, the lesson is not to ignore the risks, but to avoid letting a sharp repricing of one investment theme drive decisions about a diversified portfolio.
The opinions expressed in this commentary are those of the author and may not necessarily reflect those held by Kestra Advisor Services Holdings C, Inc., d/b/a Kestra Holdings, and its subsidiaries, including, but not limited to, Kestra Advisory Services, LLC, Kestra Investment Services, LLC, Kestra Private Wealth Services, and Bluespring Wealth Partners, LLC. The material is for informational purposes only. It a forecast of future events, or a guarantee of future results. It is not guaranteed by any entity for accu represents an assessment of the market environment at a specific point in time and is not intended to be racy, does not purport to be complete and is not intended to be used as a primary basis for investment decisions. It should also not be construed as advice meeting the particular investment needs of any investor. Neither the information presented nor any opinion expressed constitutes a solicitation for the purchase or sale of any security. This material was created to provide accurate and reliable information on the subjects covered but should not be regarded as a complete analysis of these subjects. It is not intended to provide specific legal, tax or other professional advice. The services of an appropriate professional should be sought regarding your individual situation. Kestra Advisor Services Holdings C, Inc., d/b/a Kestra Holdings, and its subsidiaries, including, but not limited to, Kestra Advisory Services, LLC, Kestra Investment Services, LLC, Kestra Private Wealth Services, and Bluespring Wealth Partners, LLC, do not offer tax or legal advice.